About Sales Heatmap
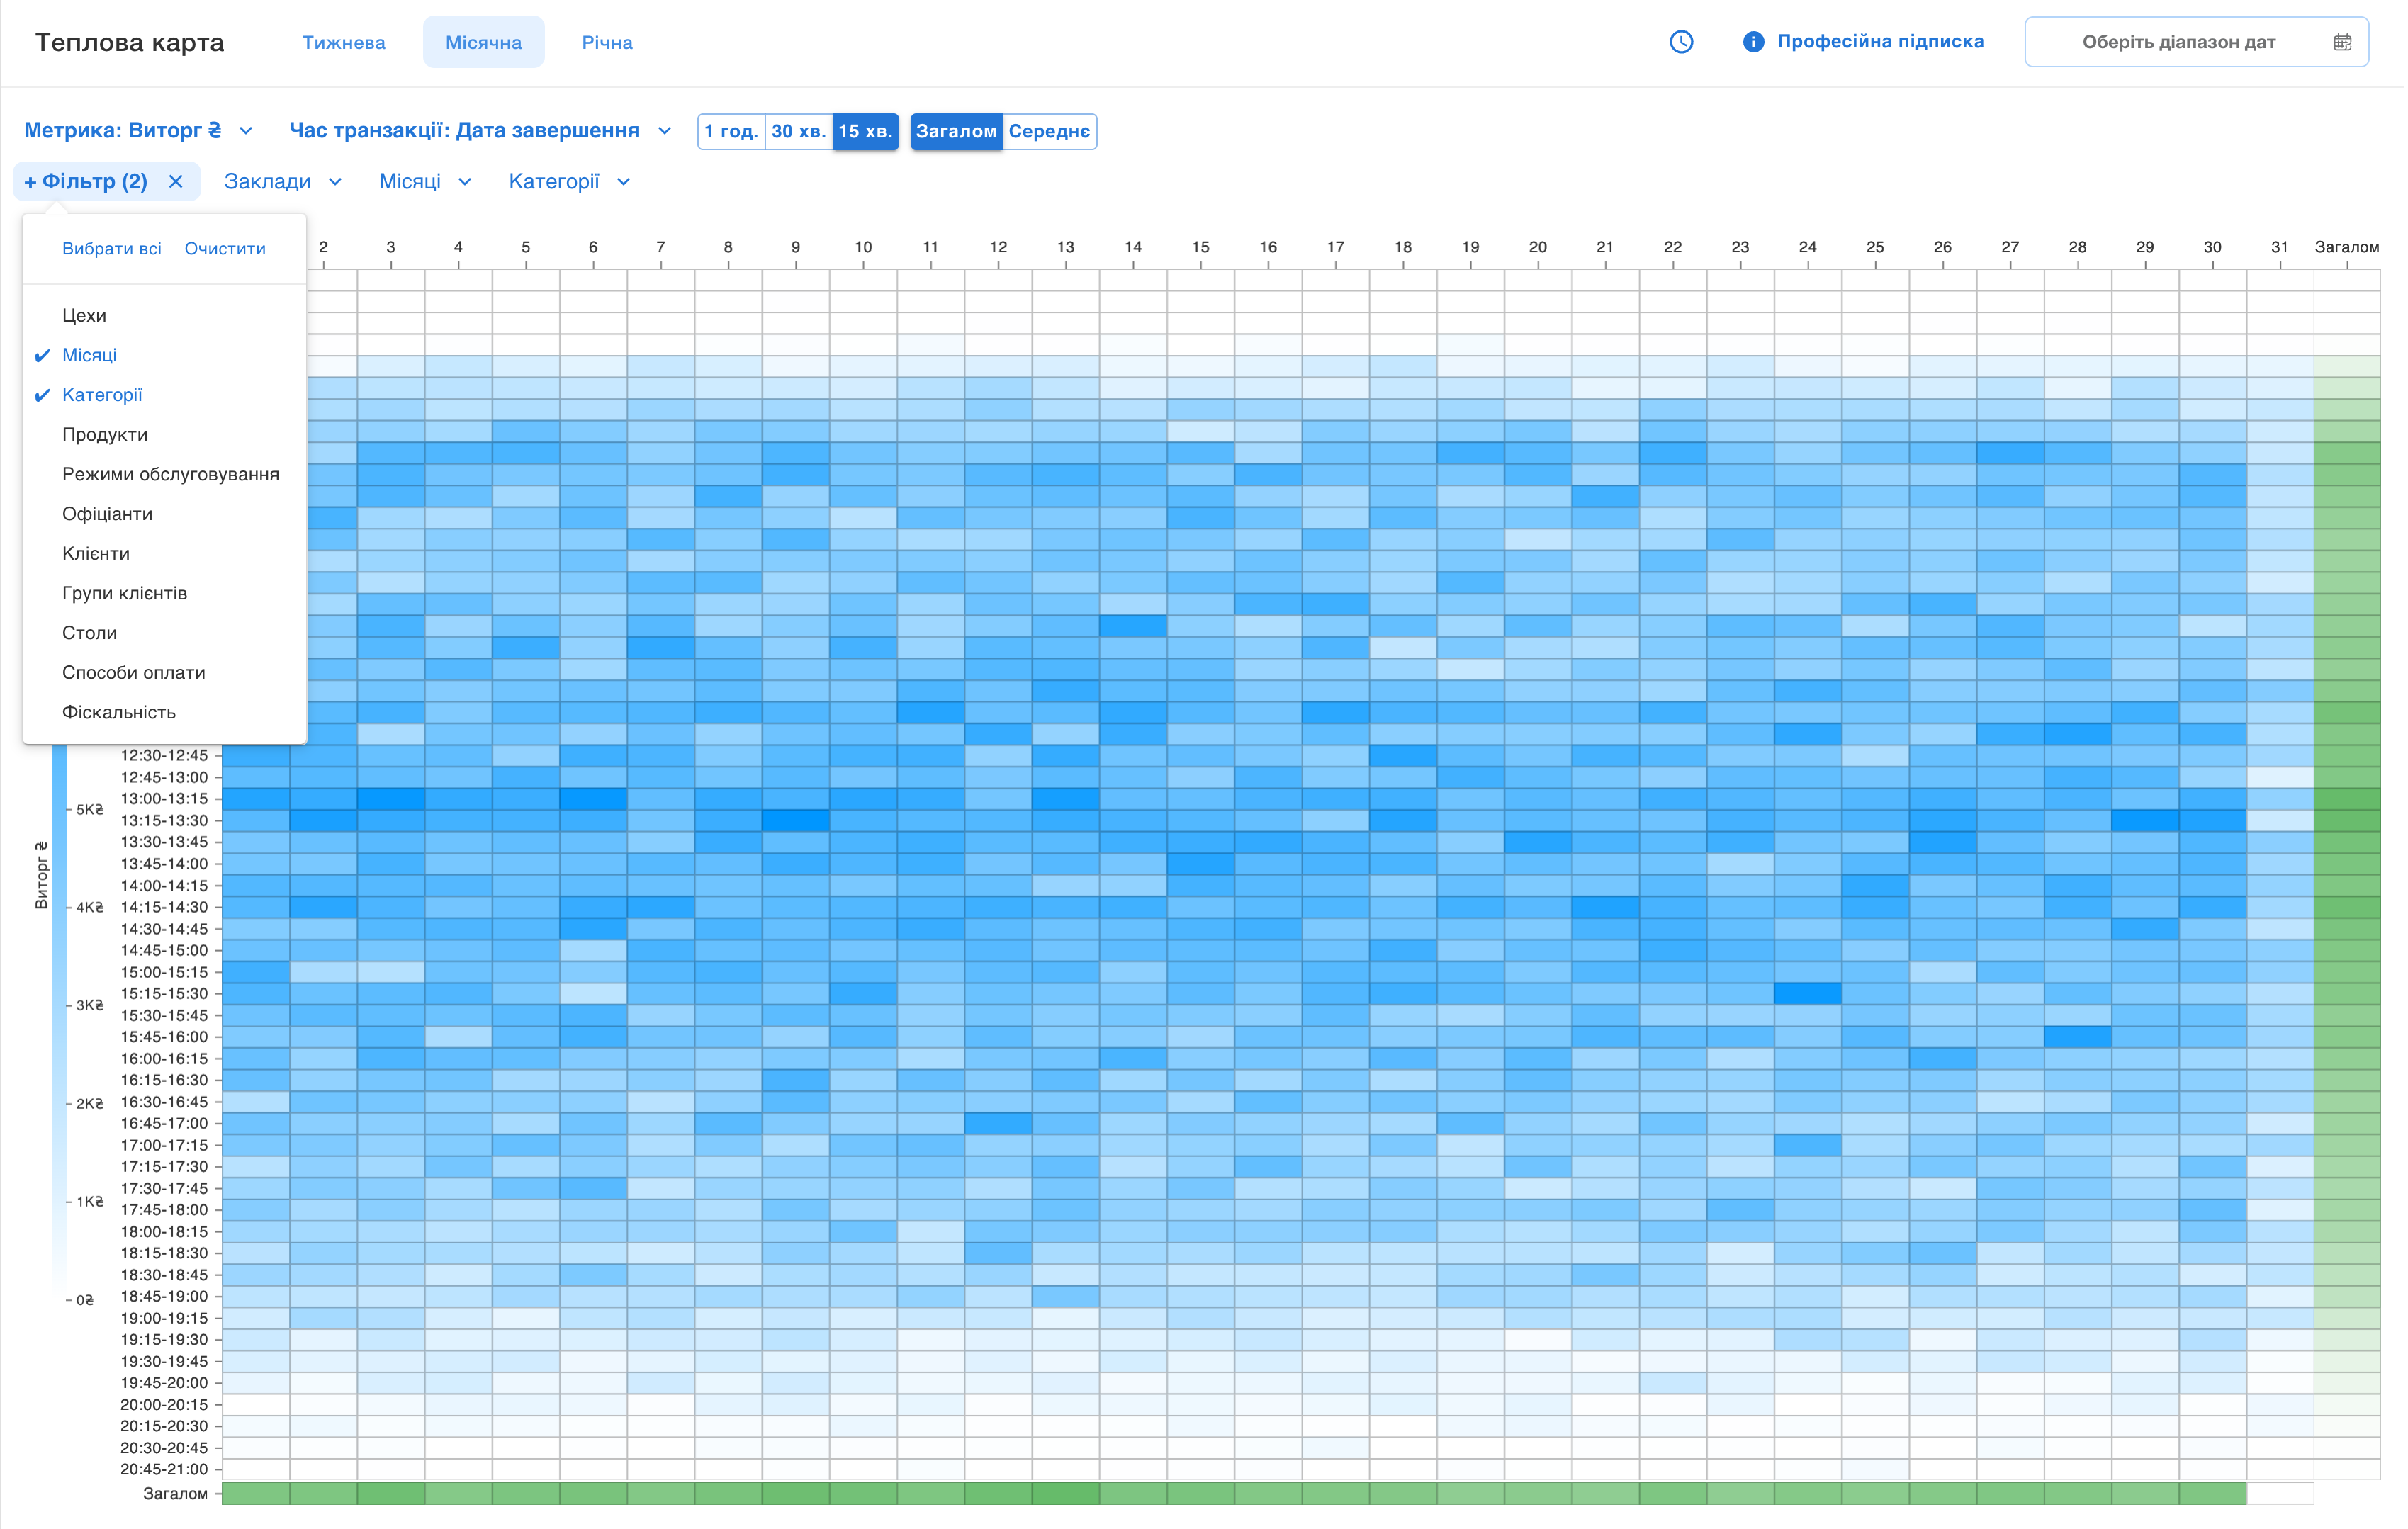
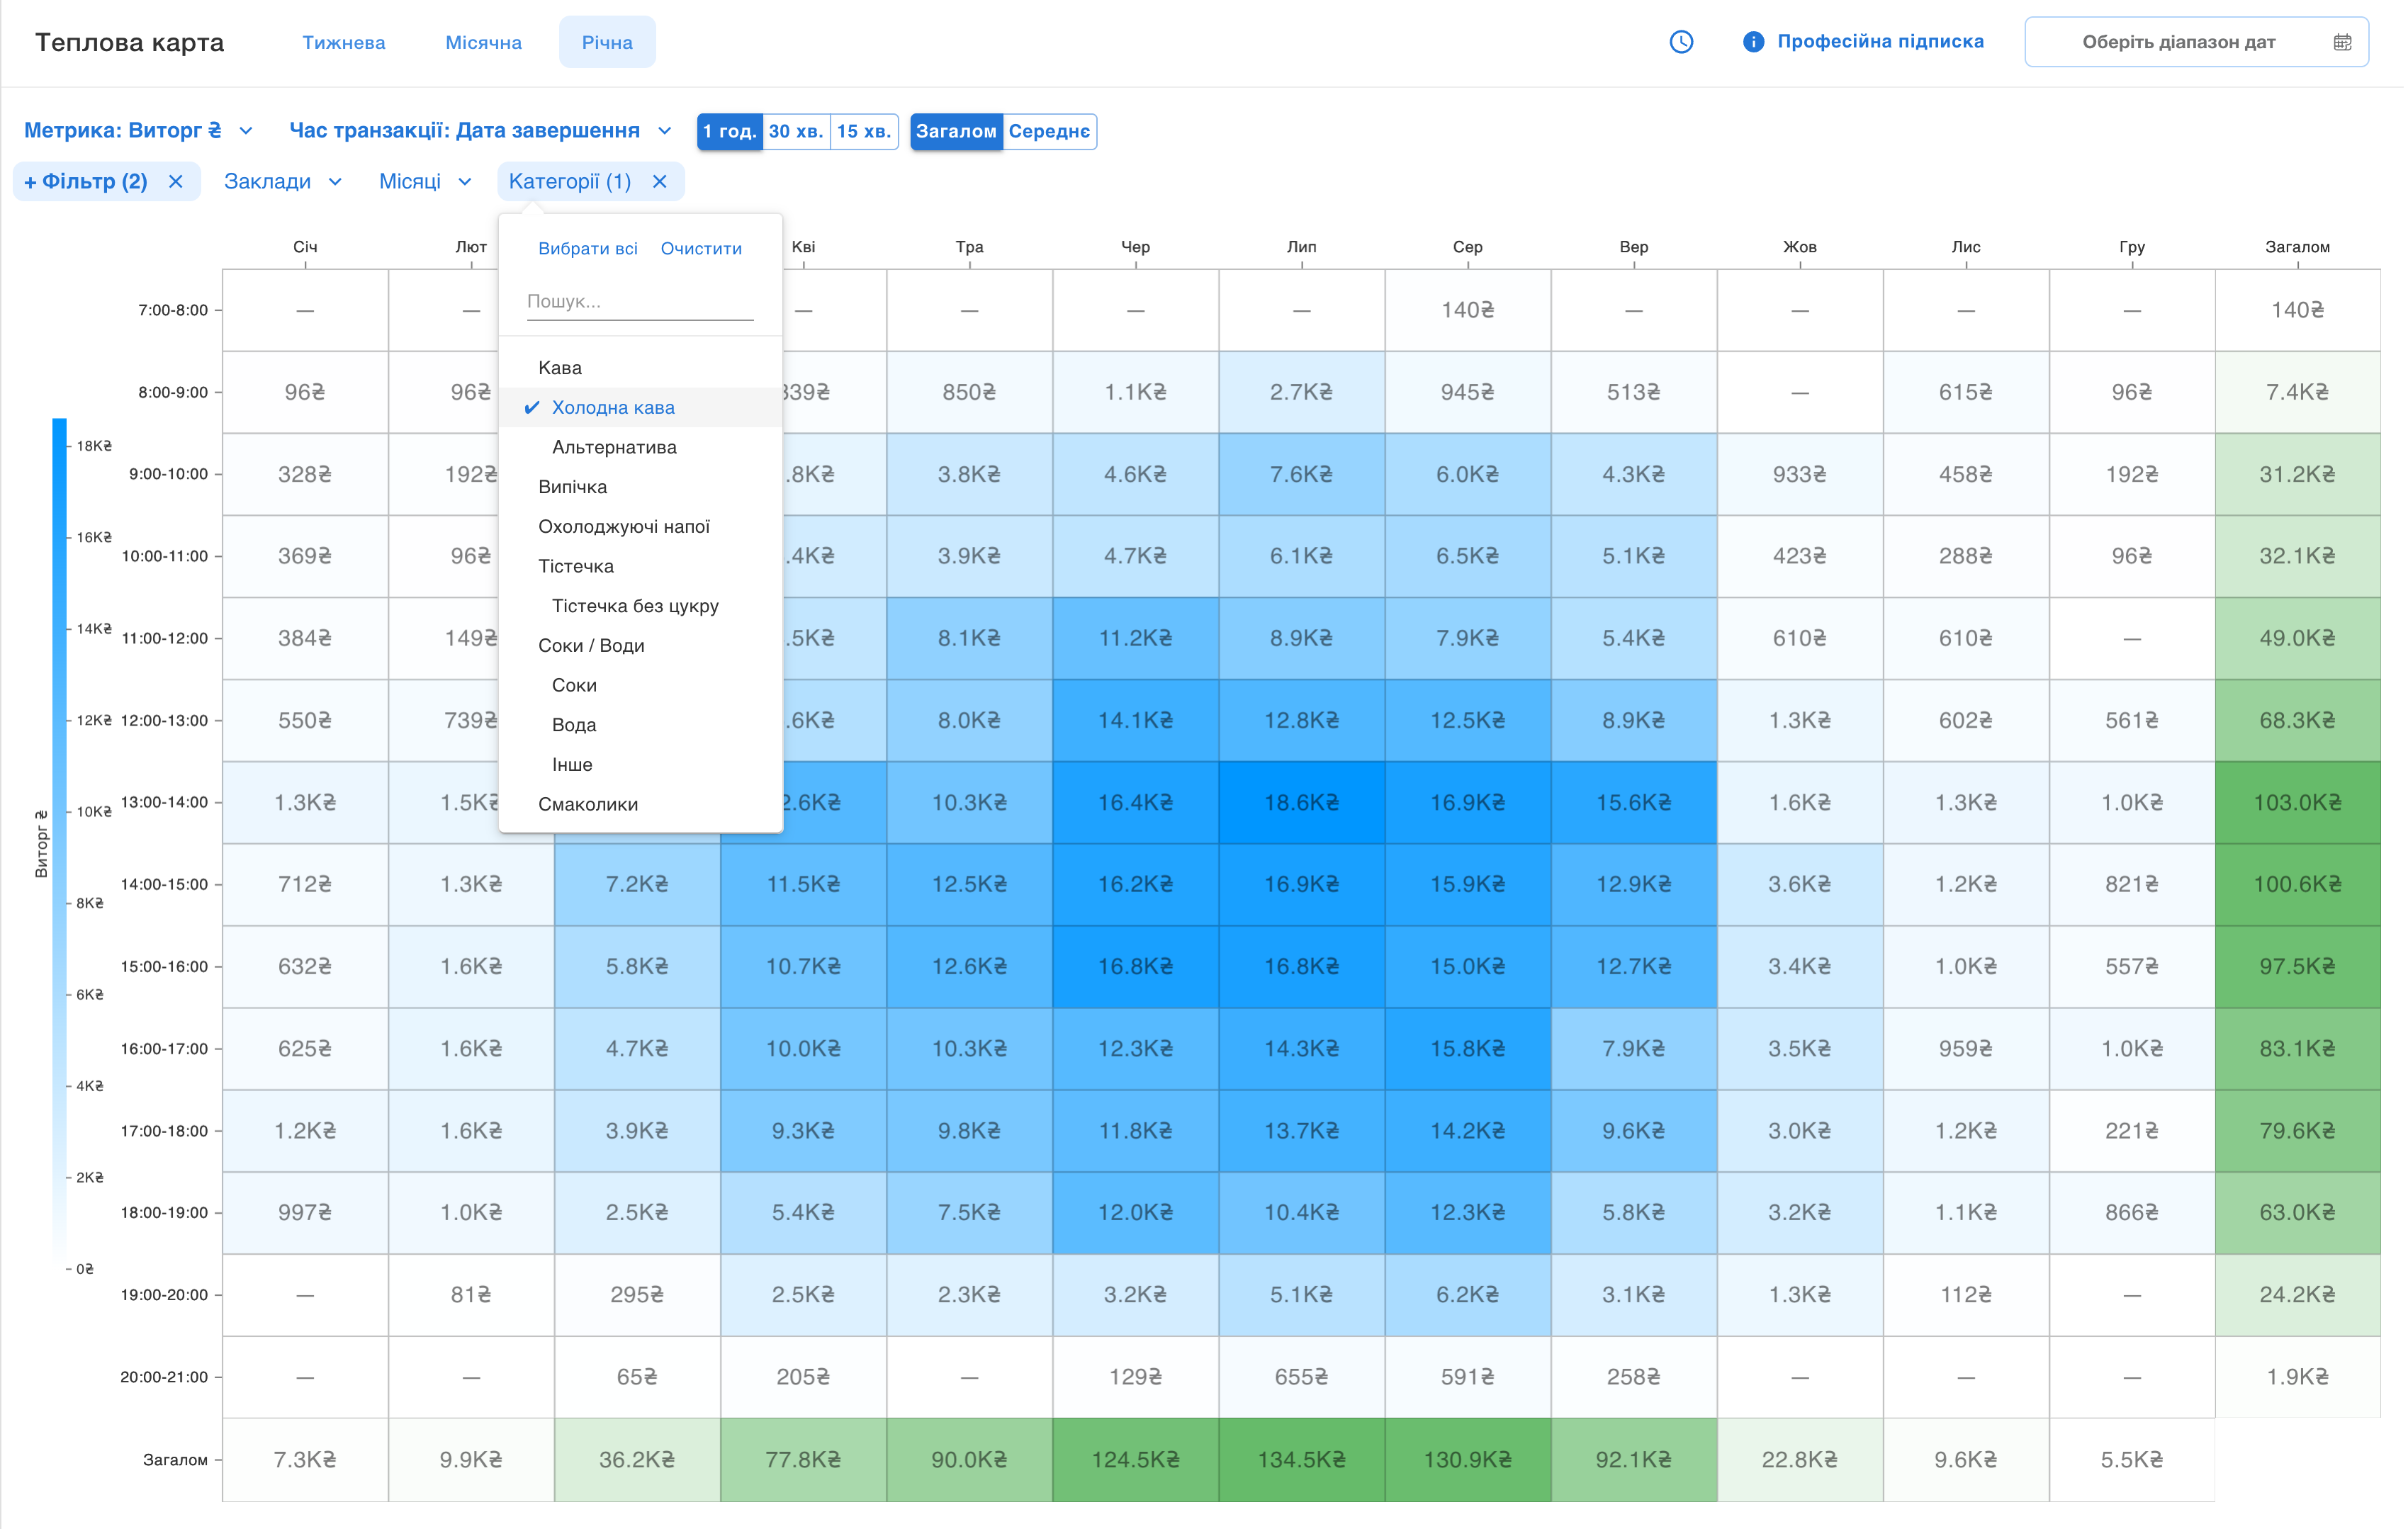
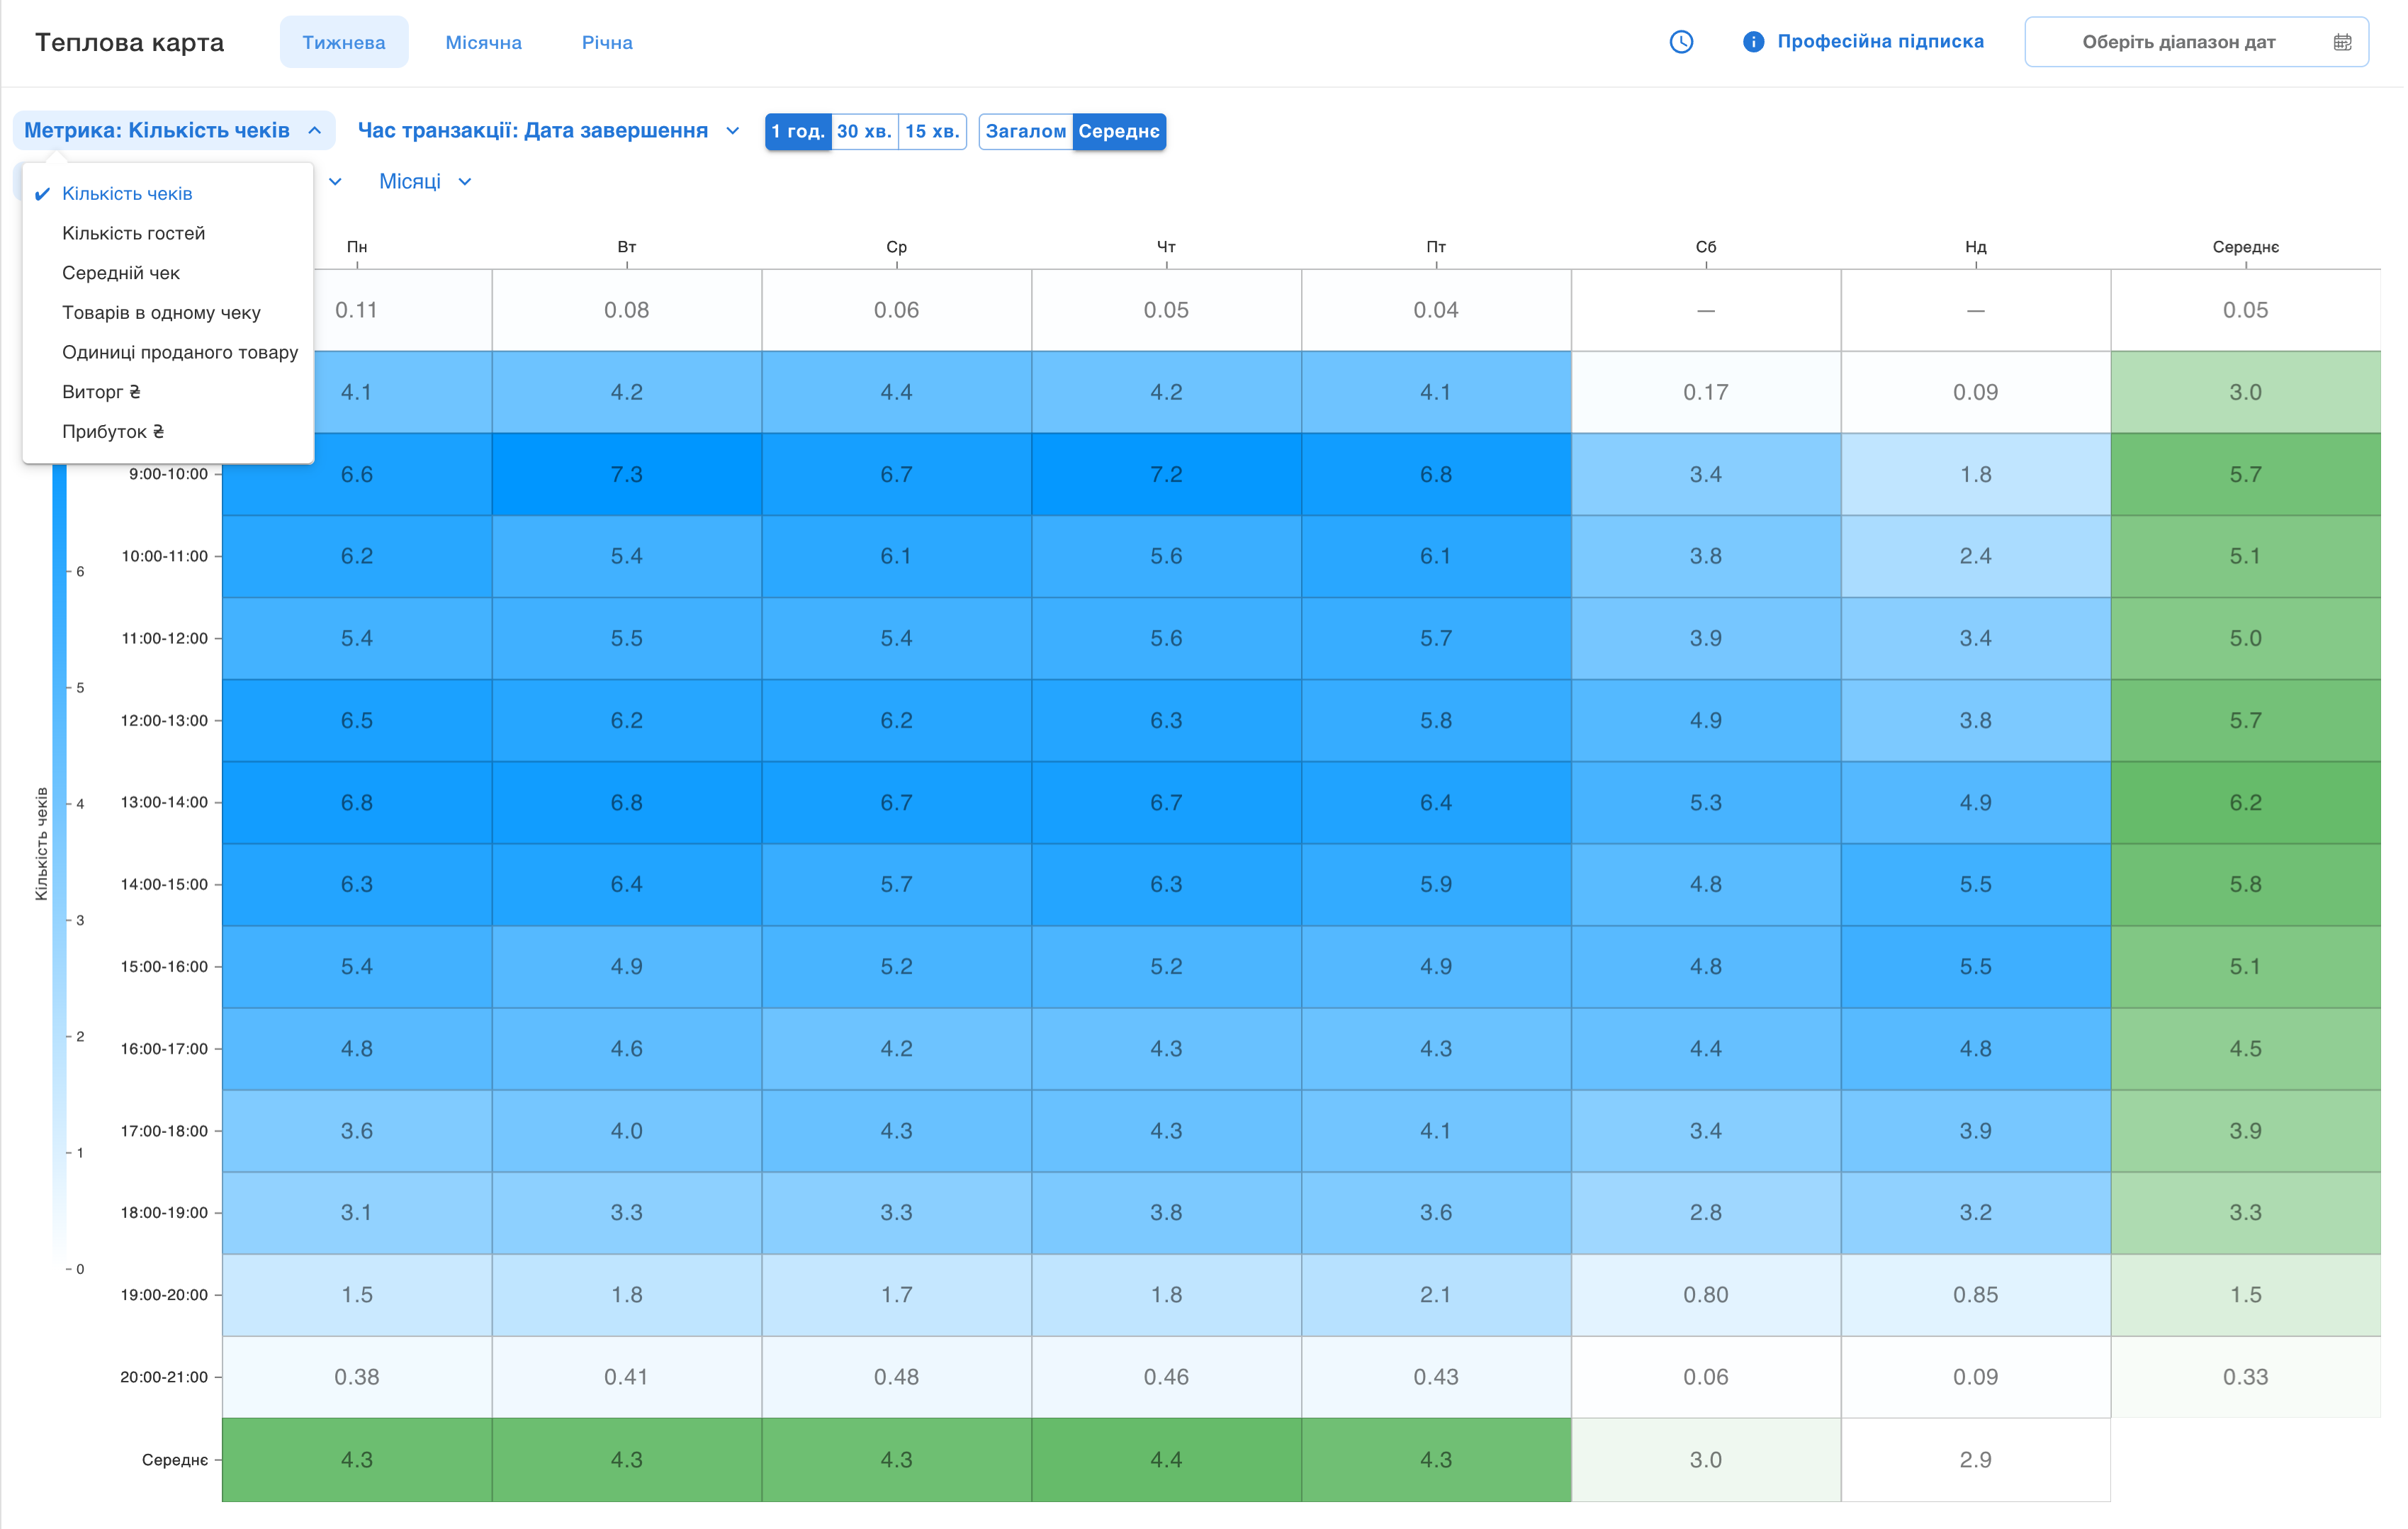
Sales Heatmap turns your Poster POS data into a visual map: peaks and dips are visible at a glance. One screen instead of tables — find hidden opportunities to grow your venue's revenue.
Features:
- 7 metrics: revenue, profit, average check, number of checks, guests, items — view sales from different angles.
- 3 periods: week (for optimizing shifts), month (for planning promotions), year (for seasonality analysis).
- 12 filters: categories, products, waiters, tables, venues and others — analyze specific data slices.
- Instant update: change the metric, period or filter — the map rebuilds automatically.
About the app
- Category
- Website
- Phone
- E-mail
- Number of installations50+
Screenshots