20 Restaurant Metrics & How to Calculate Them
December 13, 2019 • 18 minutes
Restaurants owners use many metrics for consistent evaluation of independent restaurants as well as the industry collectively. The National Restaurant Association uses them to provide meaningful insight into the industry’s health and what to expect in the future. The four key performance indicators include sales, traffic, labor, and capital expenditures. These areas will break down into many smaller and more specific restaurant metrics to drive decision making and self-evaluation. Each metric provides something unique regarding your restaurant’s performance. Some of them you can track in your restaurant POS system if it has an admin panel with robust analytics and reporting. They can help you avoid many of the costly mistakes that cause restaurants to close, such as poor cash flow management, tax complications, and labor mismanagement.
Cloud POS for restaurants
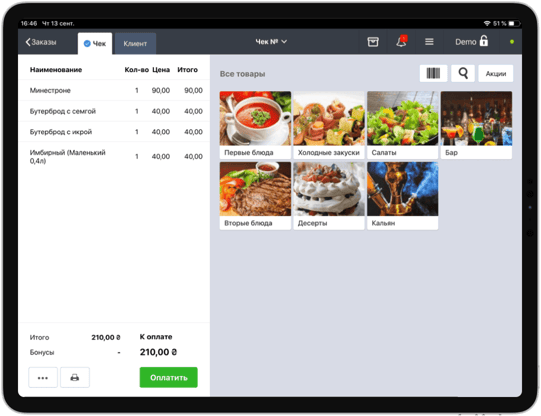
Use Poster to make sales faster, manage your inventory and finances.
1. Food cost percentage
Food costs will directly impact your bottom line. It can minimize or maximize your profit margin because any food wasted is also money wasted. Use the food cost formula to identify major operational concerns such as excess waste, incorrect pricing, or inconsiderate purchasing. For a better control over your operations, we suggest you calculate your food cost per recipe and overall restaurant food cost percentage weekly.
Food cost percentage = (Beginning inventory + purchases — ending inventory / total revenue) x 100
Your beginning inventory is everything that rolled over from your last order that is still usable or hasn’t spoiled. It’s vital to remember that your ending inventory from one month’s calculation does not automatically become the next month’s beginning inventory. Your ending inventory will include only the remaining inventory that is usable. Any food thrown out because it spoiled should be considered usage.
There is no rule on what is a functional food cost percentage. Fine dining establishments will regularly see food costs around 35%, while casual dining should try to hover around 30% or less.
Purchases will include all of your orders with food suppliers, but unexpected purchases as well. It’s not uncommon for new restaurants to have to put in an order for staples such as flour, sugar, or salt, as they run low rather than on a regular rotation.
2. Menu item profit
Look at standard casual dining corporations, and you can quickly identify that they’re pricing menus and promotions around their menu item profit calculations. Olive Garden has its ongoing «Endless Soup and Salad» for lunch. Without a doubt, they make much more serving endless soup than on nearly any other lunch item. Use the menu item profit formula to begin menu engineering. Get the most out of your profit-generating dishes.
Menu item profit = (Number of items sold x menu price) — (Number of items sold x item cost)
The number of items sold should be easy to track in your POS system. It’s merely the number of times that a guest ordered the dish. Menu price is what guests pay for the item, and you have complete control over this. The item portion cost is the expense that you experience by creating that plate. You should have this planned out for everything on the menu, even for beverages or alcoholic drinks.
To calculate your item portion cost add up your price for each ingredient, specific to the volume for the recipe. Don’t forget things like seasonings, which can add up quickly.
With this calculation, you can start strictly controlling your food cost by planning promotions and reformatting your menu. Of course, it’s important to remember that you need to consider the popularity of the dish too. Guests won’t order items that they’re not interested in, no matter the promotion.
3. Inventory turnover ratio
An inventory turnover ratio, ITR, is the time frame it takes for you to go through a complete inventory rotation. Overstocking inventory is a significant problem, mainly because it lends itself to a lot of food waste, and ultimately a high food cost. Understocking leads to shortages and angry guests. Knowing your ITR allows you and your managers to understand inventory rotation and manage the consequences of inventory management.
Inventory turnover ratio = Cost of Goods Sold / Average Inventory
or an alternative formula is:
Inventory turnover ratio = Sales / Inventory
The sales divided by inventory is the easiest formula, but it’s not as reliable for real-time insight. Your cost of goods sold is another metric that you’ll use regularly, so you will likely have that number on hand. It’s the price of all the resources necessary for making a sale. Average inventory allows restaurant owners to adapt their inventory volume based on current trends such as holidays or busy periods. It’s the total average of your inventory at any given time. Ultimately you’ll need to calculate your inventory turnover ratio regularly to learn what is a high or low-performance indicator.
4. Labor cost
Labor mismanagement is one of the most common reasons for restaurant failure. You need just enough people working to keep your kitchen and dining room running smoothly but not having anyone standing around with nothing to do. Labor is among the highest costs in any restaurant ranking right next to food costs. Still, it can set the standard for your guest’s experience.
Labor cost = Hour rate x number of working hours + taxes + benefits
For a comparable percentage, you can easily calculate:
Labor cost percentage = Total labor cost / restaurant profit x 100
The hourly rate is what the employee earns per hour. You need to calculate this for salaried employees as well by determining their hourly rate based on the number of hours they work, not what they should work. Your restaurant’s profit is the income with every expense subtracted. Those expenses include utilities, rent/mortgage, payroll, food inventory, insurance, and more. You will need to calculate this per worker, or by pay grade so that your numbers are accurate. You don’t want to use estimates or averages here. The ideal labor cost percentage will fall between 25 and 35%.
Managing your labor cost will depend on quickly responding to the changing demands of your restaurant based on the number of guests present. That means adjusting labor schedules by the hour and day to accommodate busy or slow periods.
5. Employee turnover
Knowing your turnover with employees can uncover critical problems in your operations and help you to build better processes. To start, you’ll need to track your average training hours, have a strict training plan, and know when to pull the plug on a bad hire. Poor hiring decisions can create a toxic environment that can cause good employees to leave. Or they can put a strain on your labor cost with wasted hours.
54% of employee turnover involves people quitting. People leave restaurants most often because of low pay or earning potential, «kitchen culture, ” and burnout from workplace stress.
Employee turnover = Employees who left / ((beginning number of staff / ending number of staff) / 2)
The employees who left will include everyone who either quit, was terminated or is no longer employed with you for any other reason. Your beginning number of staff is the size of your workforce at the start of your period, month, or year. The ending number of staff will be the number of your current employees at the end of the period or time frame.
6. Cost of goods sold (COGS)
Your cost of goods sold calculation is the key to seeing the forest and not the trees. Get a big-picture view of the health of your store. Many restaurant owners will use this restaurant metric to understand the ebb and flow of their business over time.
COGS = Beginning inventory + purchases — ending inventory
The beginning inventory is what you’re starting with at the top of the period. Everything on your shelves that is usable. Purchases will include all of your food orders, but not orders on things such as marketing materials that are part of operational expenses. Ending inventory will include everything on the shelves at the close of the period. Knowing this value will help you cut costs on the items you sell and boost your profit margins. Thankfully, you don’t have to go through and do these inventory calculations on pen and paper. A reliable POS system should track your inventory, purchases, and the impact of restaurant orders on your inventory levels.
7. Gross profit margin
Your gross profit will showcase your store’s revenue after removing the cost of goods sold. Usually, restaurant owners will use this metric as a percentage and have a goal percentage for the period or quarter. Gross profit is the money you have to work with to pay labor, rent, overhead expenses, and of course, yourself.
Gross profits = Total revenue — COGS
To identify the margin:
Gross profit margin = (Gross profit calculation / total revenue) x 100
The profit margin helps a restaurant know if they’re viable, or if they’re making money. The reason why it varies within the restaurant industry is because of the many different concepts and scales available. For example, a buffet will likely have a much lower profit margin than a casual dining restaurant. Because you’re only looking at the cost of goods sold and revenue at this point, a buffet may not need a 70% profit margin to be profitable and healthy. The gross profit margin helps owners identify issues in management effectiveness by evaluating COGS and sales.
8. Net profit margin
The net profit margin includes everything that was missing from the gross profit. This metric looks at the final product rather than the business aspects that are still in motion. This is the amount of profit that you actually get to keep, the money that is in your restaurant’s pocket.
In recent years, the net profit margins for the restaurant industry have increased by an average of 6,1%. Yum! brands, including KFC, Pizza Hut, and more, now regularly report net profit margins ranging between 18 and 25%.
Net profit margins = (Gross sales — operating expense) / Gross sales
Gross sales include all of your sales, that every dollar your restaurant made. Operating expenses will include everything that you need to pay to keep your doors open. That means it’s the cost of goods sold, labor expenses, rent, utilities, and any other restaurant operating expenses. While you want this number to be as high as possible, don’t be surprised if it’s very low, say 2 or 3%. By cutting costs, keeping up your standard of quality and service, while also boosting sales, you can kick this number up higher.
9. Prime cost
Restaurant owners often focus on the prime cost, which sets them apart from most other industries as it’s pretty unique to foodservice. Prime cost is entirely within the owner or management team’s control.
Prime cost = Labor + COGS
You know what your labor and COGS are, but applying them in this formula allows you to see exactly how much of your revenue was lost to your two biggest expenses. Although these elements appear in other formulas, calculating the prime cost will help show opportunities to increase restaurant revenue and reduce output by either addressing food costs or labor.
10. Overhead
These costs are eternally fixed; they’re the exact opposite of your prime costs. They’re property taxes, utilities, and mortgage or lease payments. This rate will help you know how to plan your pricing and accommodate for other areas of operations. A restaurant owner needs to plan around overhead costs because they can’t be changed. Knowing your overhead rate down to the hour will allow you to factor those costs into your day to day accounting practices.
Overhead rate = Total fixed costs / total time of open hours
Your total fixed costs should include rent, electric, water, cleaning, music subscription, trash services, and all other non-negotiable recurring bills. Time of open hours is your hours of operation per month.
11. EBITDA (Earnings before interest, taxes, depreciation, and amortization)
This calculation is vital in all accounting practices, but many restaurant owners leave it until the end of the year. EBITDA is a formula that can be helpful for quarterly check-ins to ensure your business is still stable. Your financial advisor or accountant will likely calculate this number when they step in for financial management planning. Restaurants need this formula to identify what they have earned as a result of operations without accounting for capital spending, or restaurant finance management.
EBITDA = Depreciation expenses + amortization expenses + operating profit
Or, some people prefer to calculate this based on their net income figure with this formula:
EBITDA = Net income + taxes + interest + depreciation + amortization
Depreciation will include the calculated decay of equipment, vehicles, and even some aspects of your building, such as a new roof or HVAC unit. Interest here will include all of the interest that you pay through the period, whether that be a month, quarter, or year. Amortization can apply to a few things, including debt, or the value of an asset. You may «write-off» the cost of an asset over multiple years when filing taxes, which is part of your amortization. But, your regular debt payments also fall under your amortization expenses. Operating profit is only the profit you generate from your operations, while that might seem like everything; it’s not.
Calculate your operating profit by taking your gross profit and subtracting any operating expenses. Always work with a finance manager or accountant to estimate your upcoming taxes. Not anticipating your taxes can lead to extreme cash flow difficulties as you fumble on paying the proper agency.
12. Break-even point
Your break-even point is what makes sure that you’re going to work for a purpose. If you don’t hit the break-even point, then you might want to consider revitalizing the store with an expert consultant or selling. It’s possibly the most important restaurant performance metric because it tells you how much you need to make to stay in business.
The break-even point provides a guiding light for setting revenue goals, pulls the longevity of the restaurant at the center of attention, and helps owners know when they start making a profit.
Break-even point = Total fixed costs / ((Total sales — all variable costs) / total sales)
Your total fixed costs are all of your unchanging bills, such as rent and utilities. Don’t forget other ongoing expenses, such as the cost of your security system. Total sales include everything that you make through your register. Variable costs include your food costs and labor expenses. Together these expenses with the total sales can help you know if you made any money. You can use the prior month or quarter’s restaurant break-even analysis to set goals for the upcoming period.
13. Average seat cover
How much does each seat bring into your restaurant? Using the average cover per seat can help give managers an idea of how many table turns they need per night or plan for sales forecasts. Some POS systems can even calculate this for you if you go through the process of setting up the seats in the dining room and mapping out your table turns.
Average cover per seat = Total sales per day / Number of guests served per day
Use the average cover for sales forecasts, and to manage promotions to boost your average cover when you see it dropping.
The downside is that this average doesn’t account for factors that management encounters every day, which impact this metric. Factors such as servers that turn tables quickly, or tables that host larger parties turn more slowly. The average gives a round figure, but it is not the «end-all-be-all» of a seat’s value.
14. Revenue per available seat hour
The food and beverage performance metric of «RevPASH» or revenue per available seat hour enables for top-quality planning. This calculation is strictly a performance tool, specifically one for management performance. It goes a step further than the average seat cover by associating a value based on seat and time. Managers can use this figure hour by hour to make labor decisions or to host specials on menu items with higher profits.
RevPASH = Total sales per day / (number of seats x number of hours open)
Total sales per day include all the restaurant’s sales for that day. Number of seats includes every available seat, not counting employee tables. Number of hours open is the total of your operating hours for the day.
15. Table turnover
Every single restaurant manager, owner, and even serving staff should worry about table turns. How fast do your tables move on a Tuesday night versus a Friday night? Knowing that number can help you plan for staffing needs, nightly specials, and more.
Casual and fast-casual restaurants should aim for a table turn about every 45-minutes. However, fine dining establishments may only have table turns every 2 hours. The ideal table turn timeframe depends on your concept.
Table turnover rate = Volume of guests served in a time frame / number of seats
Volume of guests needs to have a specific time limit. Usually, this applies to a breakfast, lunch, or dinner service. Some restaurants will separate this by shift rather than service.
16. Time for table turns
The time frame for a table turn will help managers put the right serves in the right spot. While your table turnover gave you a figure on how many times each table turned through a shift, this gives you a time in minutes.
Time for table turn = Time the server opens the check — Time the table cashes out
If it took a long time for a table to turn, you want to consider what proactive measures your servers are using. Steps such as laying the check down when plates are clear, and offering coffee after they finish their entrees are polite ways of turning tables faster.
17. Customer headcount
Keeping track of this metric helps you and your team know how you’re performing hour-to-hour and day-to-day. Run contests and give awards for high turnover rates or use customer headcounts for future projects on labor and food demands.
No calculation needed; simply check your POS system for the analytics on the number of customers served in a limited timeframe.
Managers may check the headcount by the hour, shift, day, or any other variation of time. The customer headcount will produce a foundation for calculating future sales forecasts, inventory planning, and scheduling promotions.
18. Customer acquisition cost
Traditionally used in marketing, the cost it takes to bring in new customers under one promotion can help you plan out your next marketing strategy. Restaurants now use social media as well as traditional advertising methods, and you will need to track the expenses for both methods.
Cost of acquiring new customers = Marketing expenses / number of new customers
Include any marketing expenses such as printing table tents, paying for ads on Facebook or Instagram, creating pins or stickers to push the promotion through serving staff. But these expenses should also account for your losses associated with a promotion’s discount. Number of new customers is a number that you can pull from either your POS system if you required people to sign up through an email or phone number to access the discount. When you have the customer acquisition cost, you will need to compare that to the gross profit made off of those customers.
19. Customer retention rate
It’s easier for restaurants to keep customers than to get new customers. It can cost 5x more to bring in new customers. Instead, use a loyalty club to encourage guests to return regularly and to track your customer retention. Use a POS that has a customer base platform, where you can market to customers with discounts and bonuses.
Сustomer retention percentage = ((Total customers — new customers) / total customers) x 100
Finding your total customers is easy with a POS system that shows you the volume of customers per month. Calculating new customers requires a bit of math. Subtract the number of loyalty program customers present during the month from the total customers for the month, and you’ll have your new customer figure.
A loyal customer is 5 times as likely to return and forgive for poor performance. They are also 4 times more likely to refer a friend and 7 times more likely to try something new at your store.
20. Restaurant average check
Average check is the amount of money earned divided by the number of customers a restaurant had over a certain period of time.
Restaurant average check = Earnings per day / Number of customers
By tracking your restaurant average check, you’ll find out if the upselling techniques your employees use are effective or not.
Key restaurant performance metrics can change how you evaluate the health of your store and impact your daily activities. Involve your management team in tracking these metrics and putting them to good use. Your kitchen managers should know their food costs at all times, while your service managers should have a good handle on tables turns. Of course, these metrics should involve everyone. Your service staff can play a role in reducing food waste, and your kitchen staff can help increase table turns and improve customer retention. Use these metrics to control and improve almost every aspect of operations.